RFID Site Survey & Tag Testing
A site survey and a disciplined tag-testing programme are what separate RFID projects that work on day one from those that need months of rework. This chapter explains what to measure on site, which tools to use, how to test tags methodically and how to write results up so that everyone agrees what "working" means.
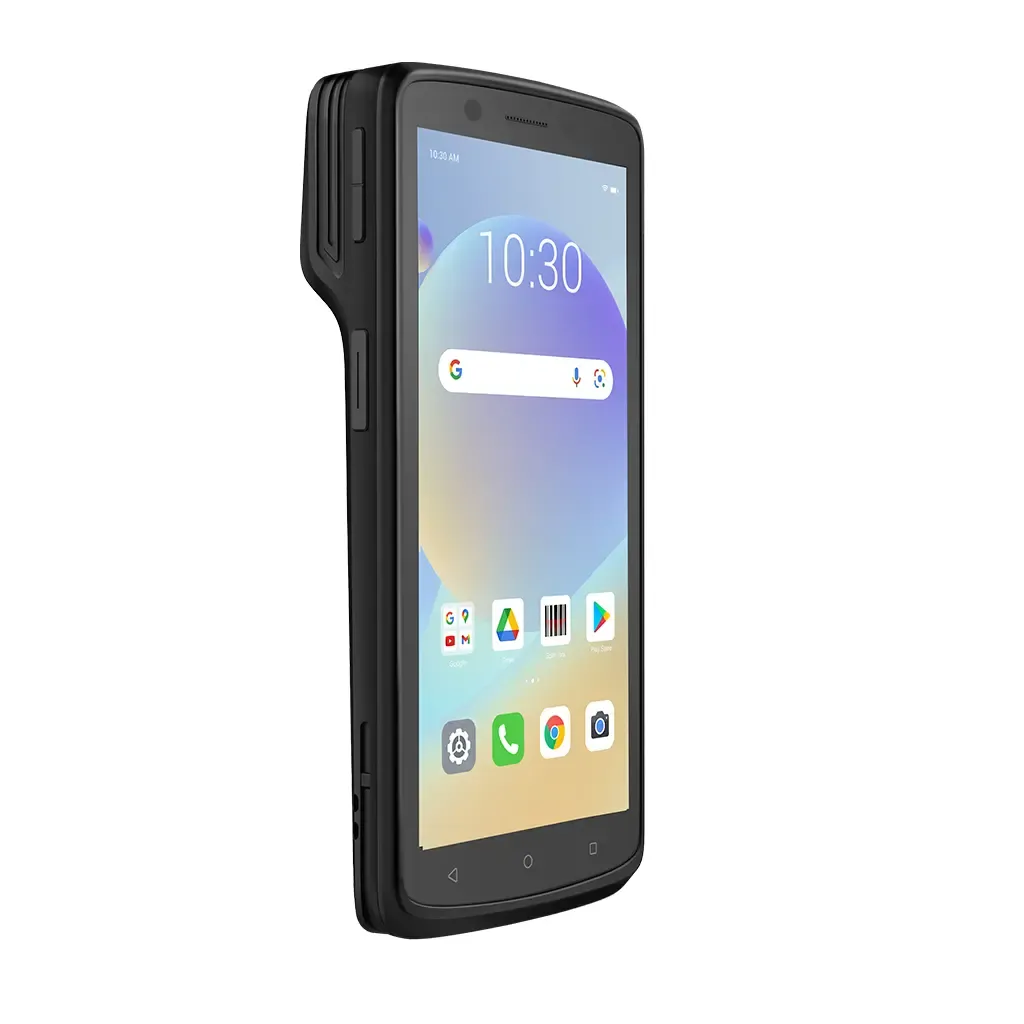
- A site survey records the RF environment, physical layout, metal, liquids and available power and network points before any hardware is chosen.
- Tag testing should be done on the real product, in the real packaging, at the real speed and orientation - not on a desk with a single loose inlay.
- Minimum read (turn-on) power and read-rate tests turn vague opinions about a tag into numbers that can be compared and repeated.
- Bulk carton, tunnel and portal tests must use realistic quantities, densities and movement, because tags shadow and detune each other.
- Agree written acceptance criteria and a test-report format with the business before the pilot, so success is measured, not argued.
Why site surveys and tag tests matter
RFID is a radio technology, and radio behaves differently in every building. The same reader and tag that read perfectly in a demo room can struggle beside a steel rack, a cold-store door or a conveyor full of bottled water. Most failed or delayed RFID projects do not fail because the technology is unsuitable; they fail because nobody measured the environment or tested the tag on the actual product before ordering hardware.
A site survey answers "what is this place like for RF, and where can equipment physically go?". Tag testing answers "which tag, in which position, gives reliable reads on this product, in this process?". Together they feed the design described in the RFID implementation guide and protect the project budget.
Both activities happen before the pilot. Done well, they take days rather than months and cost a small fraction of the project, yet they remove most of the surprises.
What to measure during a site survey
Walk the whole process from goods receipt to dispatch (or whichever flow is in scope) and record the following at every proposed read point.
RF noise floor and interference
The noise floor is the background RF energy in the reader's band when your system is not transmitting. A passive UHF reader has to hear very weak tag replies, so a raised noise floor reduces the distance at which it can decode tags. In India, UHF RFID operates in the 865-867 MHz band. Possible sources of interference include other RFID readers, nearby cellular base stations in adjacent bands, poorly shielded motor drives, induction heaters, welding equipment and some industrial wireless devices. Record the level at different times of day, because shift changes and machinery cycles can change the picture.
Other RFID readers
List every existing RFID system on site - access control, older UHF readers, gate systems at the dock next door. Note their frequency, rough location and whether they can be configured. Multiple UHF readers in one area need channel planning and dense-reader settings, otherwise they can interfere with each other's reception.
Metal, liquids and structure
Metal reflects UHF energy and liquids absorb it. Note steel racking, mesh cages, roller conveyors, metal doors, roller shutters, refrigerated units, and products that are metallic or water-based. Reflections are not always bad - they can fill in coverage - but they also create dead spots (nulls) and cause stray reads from areas you did not intend to cover.
Layout and traffic
- Dimensions of doors, dock openings, conveyors and aisles, with photographs and a sketch or floor plan.
- How goods move: by hand, trolley, pallet jack, forklift or conveyor, and at what speed.
- Distance between neighbouring read points (two dock doors side by side are a classic cross-read risk).
- Where people stand and walk, which matters for safety and for body shielding of tags.
Power, network and mounting
For each read point, note the nearest mains outlet, whether Power over Ethernet (PoE) is available, network cabling or Wi-Fi coverage, and what the reader and antennas can be mounted on. Measure antenna cable runs; long runs of thin coaxial cable lose noticeable signal, so readers usually need to sit close to their antennas. Also record environmental conditions - dust, moisture, washdown, temperature, vibration - that affect enclosure choice.
Tools for surveying and testing
Handheld readers
A handheld RFID reader is the most useful single tool. With adjustable power and an RSSI (received signal strength) display, it lets you check whether a tag can be read at a location, find dead spots, and compare candidate tags quickly. Many handhelds also have a "locate" or "Geiger counter" mode for finding stray tags that cause unexpected reads.
A test fixed reader and antennas
Bring at least one fixed reader with a pair of antennas similar to those planned. Fixed readers log every read with timestamp, antenna port and RSSI, which is far better evidence than watching a handheld screen. Mount them on portable stands so that heights and angles can be changed during tests.
Spectrum analysis
A spectrum analyser shows RF energy across a range of frequencies, so you can see whether the band is quiet, whether other readers are transmitting, and whether broadband noise is present. You do not always need a dedicated instrument: many fixed readers can report the noise level or detect other readers on each channel. Use a proper analyser when the site is electrically noisy or read problems cannot be explained by layout and tags.
Test tags and accessories
- A selection of candidate tags - labels, on-metal tags, hard tags - in sufficient quantity.
- Reference tags of a known type, used as a constant to compare test days and locations.
- Measuring tape or laser distance meter, protractor or angle guide, masking tape and markers.
- A laptop with reader software that can export logs to a spreadsheet.
Tag testing methodology
The golden rule is to test on the real item, in the real packaging, in the real process. A loose inlay on a cardboard sheet tells you very little about how it will behave on a steel part or a shampoo bottle. Change one variable at a time and repeat each test enough times to separate genuine differences from random variation.
Placement tests
Try each candidate tag at several positions on the item: top, side, corner, near and away from metal parts or liquid contents. Mark the positions with a code (P1, P2, P3) so results can be compared. The best position is often the one with the most air or plastic between the tag and the contents, and one that is consistently reachable by the antennas in the process.
Orientation tests
Most UHF reader antennas are circularly polarised, but tags have a preferred orientation and a weak spot along the axis of their dipole. Rotate the tagged item through 0, 45 and 90 degrees in each plane and record reads and RSSI. If items can arrive in any orientation, the system must work in the worst one, or the design needs more antennas or a different tag.
Minimum read power (turn-on sensitivity)
This is the most useful single number for comparing tags. Fix the distance and orientation, start the reader at low transmit power and increase it in small steps until the tag responds reliably. The lowest power that gives a reliable read is the tag's turn-on power in that set-up. A tag that wakes at lower power has more link margin: the difference between the power you are allowed to transmit and the power the tag needs. In free space, each extra 6 dB of margin roughly doubles the forward-link range, which is why a few dB of difference between two tags matters in practice.
Repeat the measurement on the real item, because the item detunes the tag antenna. A tag that is excellent in air may be poor on a bottle, and an on-metal tag may be poor when not on metal. The RFID read range chapter explains the physics behind this.
Read-rate tests
Read rate is the percentage of tags read out of those present, and it is what the business cares about. Pass a known population of tagged items through the read zone many times, compare the list of EPCs read against the list of EPCs present, and record misses. Use a fixed, documented reader configuration (power, session, search mode, read duration) so results can be reproduced.
Bulk and carton tests
Tags close together shadow and detune each other, and contents block the signal. Fill real cartons with tagged items packed the way the supplier packs them, then test with all realistic carton positions on a pallet or trolley - including tags in the centre of the load, which are the hardest to read. Try the worst products, such as liquids and foil packaging, not just the easy ones.
Tunnel and portal tests
Set up the planned portal, gate or conveyor tunnel as closely as possible to the final design and move goods through it at real operating speed. Test faster than normal as well. Check for stray reads: tags read from goods waiting nearby, passing in the next aisle or stored behind the portal. A portal that reads everything is useless if it also reads things that did not pass through it.
Environmental tests
Where tags must survive harsh conditions, test them under those conditions before committing:
- Temperature: freezer, autoclave, oven or outdoor sun cycles, including adhesive performance at low temperature.
- Washing: industrial laundry cycles, chemicals and pressing for textile tags; pressure washing for returnable containers.
- Abrasion and impact: handling, conveyor wear, stacking, forklift knocks and vibration.
- Moisture and chemicals: humidity, oils, solvents and cleaning agents.
Measure turn-on power and read rate before and after each set of cycles. A tag that still reads but needs much more power after 50 washes is close to the end of its useful life.
Documenting results
Testing is only valuable if someone else can understand and repeat it. For every test record:
- Date, time, location and the person testing.
- Reader model, firmware, antenna type, cable length and mounting height and angle.
- Reader settings: transmit power, channel or frequency plan, session and target, search mode, read duration.
- Tag type, chip, placement code and orientation, and the item and packaging tested.
- Quantities: tags present, tags read, number of passes, speed.
- Raw logs, exported and kept with the report, plus photographs of the set-up.
- Observations, such as "missed tags were all in the centre layer" or "stray reads from staging lane B".
Keep a version-controlled test log. When a later change - a new packaging supplier, a firmware update - causes problems, the original results provide a baseline.
Setting acceptance criteria
Acceptance criteria are the written, measurable conditions the system must meet. Agree them with operations, IT and finance before the pilot, not after. Good criteria are specific to each read point and process. Typical elements include:
- Read rate per read point (for example, a target percentage of item tags read per carton, or every pallet tag read at a dock door).
- Stray-read limit: tags outside the intended zone must not be recorded, or must be filtered out by software.
- Throughput: reads must complete at normal process speed without slowing people or conveyors.
- Data accuracy: events reach the business system correctly and within an agreed time.
- Tag durability: tags still meet read targets after the expected number of cycles or months.
- Test conditions: the number of runs, quantities and product mix over which the target must be achieved.
Targets should reflect what the process genuinely needs. Demanding a perfect result where a near-perfect one is adequate can make a project far more expensive; accepting a weak result where completeness matters, such as dispatch verification, defeats the purpose.
Sample test-report table
The table below shows a simple format for comparing candidate tags. The values are illustrative, to show how results are laid out; your own figures will depend on the reader, antennas, product and set-up.
| Test ID | Tag / placement | Item | Test | Settings | Result | Pass? |
|---|---|---|---|---|---|---|
| T-01 | Tag A, P1 (side panel) | Plastic bottle, filled | Turn-on power at 1 m, 0° | Power stepped up in 0.5 dB steps | Read at moderate power; good margin | Yes |
| T-02 | Tag A, P1 | Plastic bottle, filled | Turn-on power at 1 m, 90° | As T-01 | Needed much higher power | Marginal |
| T-03 | Tag B, P2 (shoulder) | Plastic bottle, filled | Turn-on power at 1 m, 90° | As T-01 | Lower power than T-02 | Yes |
| T-04 | Tag B, P2 | Carton of 24 | Bulk read, 20 passes | Fixed power, session 1 | Centre-layer misses on 3 passes | No |
| T-05 | Tag B, P2 | Carton of 24 | Tunnel, conveyor speed | 4 antennas, session 1 | All tags read on all passes | Yes |
| T-06 | Tag B, P2 | Staged cartons 2 m away | Stray-read check | As T-05 | No stray reads recorded | Yes |
A summary at the top of the report should state the recommended tag and placement, the reader configuration, the read points tested, any open risks and the next step.
Common mistakes and good practice
- Testing in the office instead of on site. The office has no racking, no conveyors and no neighbouring dock doors.
- Using one tag sample. Individual tags vary; test several of each type.
- Changing several variables at once. If you move the antenna and change the tag together, you will not know which change helped.
- Ignoring the worst-case product. Design for the hardest item, not the average one.
- Forgetting regulatory limits. Test with power settings that will be legal in the final installation; in India that means operating within WPC rules for the 865-867 MHz band.
- Not involving the people who do the work. Operators know how items really move, stack and get handled.
If your team does not have the instruments or experience, an external survey is a sensible investment. Indian RFID's RFID consulting service carries out site surveys and tag trials, and the hands-on side of surveying is also practised in the Certified RFID Specialist Program. Once the tag and placement are proven, the next step is producing tags at scale, covered in RFID printing and encoding.
Help India adopt this fast-growing technology - teach, consult or build projects with Indian RFID.
Frequently asked questions
What is an RFID site survey?
It is a structured visit to the place where RFID will be used, to record the RF environment, physical layout, metal and liquids, existing wireless systems, and the power, network and mounting options at every proposed read point. Its output is a report that drives hardware selection and placement.
Do I need a spectrum analyser for an RFID site survey?
Not always. Many fixed readers can report background noise or detect other readers, and that is enough for most warehouses and shops. A spectrum analyser is worth bringing to sites with heavy industrial equipment, many existing readers or unexplained read problems.
What is turn-on sensitivity or minimum read power?
It is the lowest reader transmit power at which a tag still responds at a fixed distance and orientation. A tag that wakes up at lower power has more link margin, so it will usually read further and more reliably on the real product.
What read rate should an RFID project aim for?
It depends on the process. Item-level inventory counts often target 98 to 99 percent or better, while a portal confirming pallets may require every pallet tag to be read. The target must be agreed with the business and written into the acceptance criteria before testing starts.
How many tags should be used in a tag test?
Enough to show variation between individual tags and items. A useful starting point is several tags of each candidate type on several real items, followed by full cartons or pallets for bulk tests, repeated multiple times so a single lucky or unlucky run does not decide the result.
Join the 1-month Certified RFID Specialist Program - live online. New batch 12 January 2027.